HD(CP)² - High-Definition Clouds and Precipitation to advance Climate Prediction
ICON Model
ICON, the ICOsahedral Non-hydrostatic model that is jointly developed by the Max Planck Institute for Meteorology (MPI-M) in Hamburg and the German Weather Service (DWD) in Offenbach is a framework defined on an icosahedron with equal area projection. The model data is sampled on a dual lattice, consisting of triangular and hexagonal cells, allowing for C-grid type discretization, compare with Figure 1. A more detailed grid description can be found in [1]. Although ICON data is not as easily accessible as data stored on a regular or curvilinear grid, it has, nevertheless, several advantages. Due to its layout, ICON has no poles and allows for an easy refinement in local areas if needed. Furthermore, the coupling between ocean and atmospheric models is much easier as both share the same grid layout with different resolutions. Similar models to ICON in terms of grid structure are the American MPAS, the Model for Prediction Across Scales, and the Japanese NICAM, the Nonhydrostatic ICosahedral Atmospheric Model.
![]()
Figure 1. ICON Grid Layout showing triangles (cell data) and hexagons (point data)
More recently, the ICON model was extended to permit large eddy simulations at cloud resolving scales as part of the HD(CP)² project for high-definition simulations of clouds and precipitation processes to advance climate prediction. HD(CP)² aims to foster the understanding about clouds and cloud building procedures, as well as other involved processes, such as precipitation or the development of hail. The amount of data produced by HD(CP)² is enormous and requires new strategies to cope with the ever growing data sizes.
HD(CP)² and Domains
High resolution simulations over Germany are performed for four days in April and May 2013. Particularly these days are chosen as they occur within the period of the extensive measurement campaign HD(CP)² Observational Prototype Experiment. The specific days (24-26 April 2013 and 2 May 2013) were chosen to reflect a range of different spring-time central-European weather conditions (cloud-free, cumulus clouds, synoptic-scale driven).
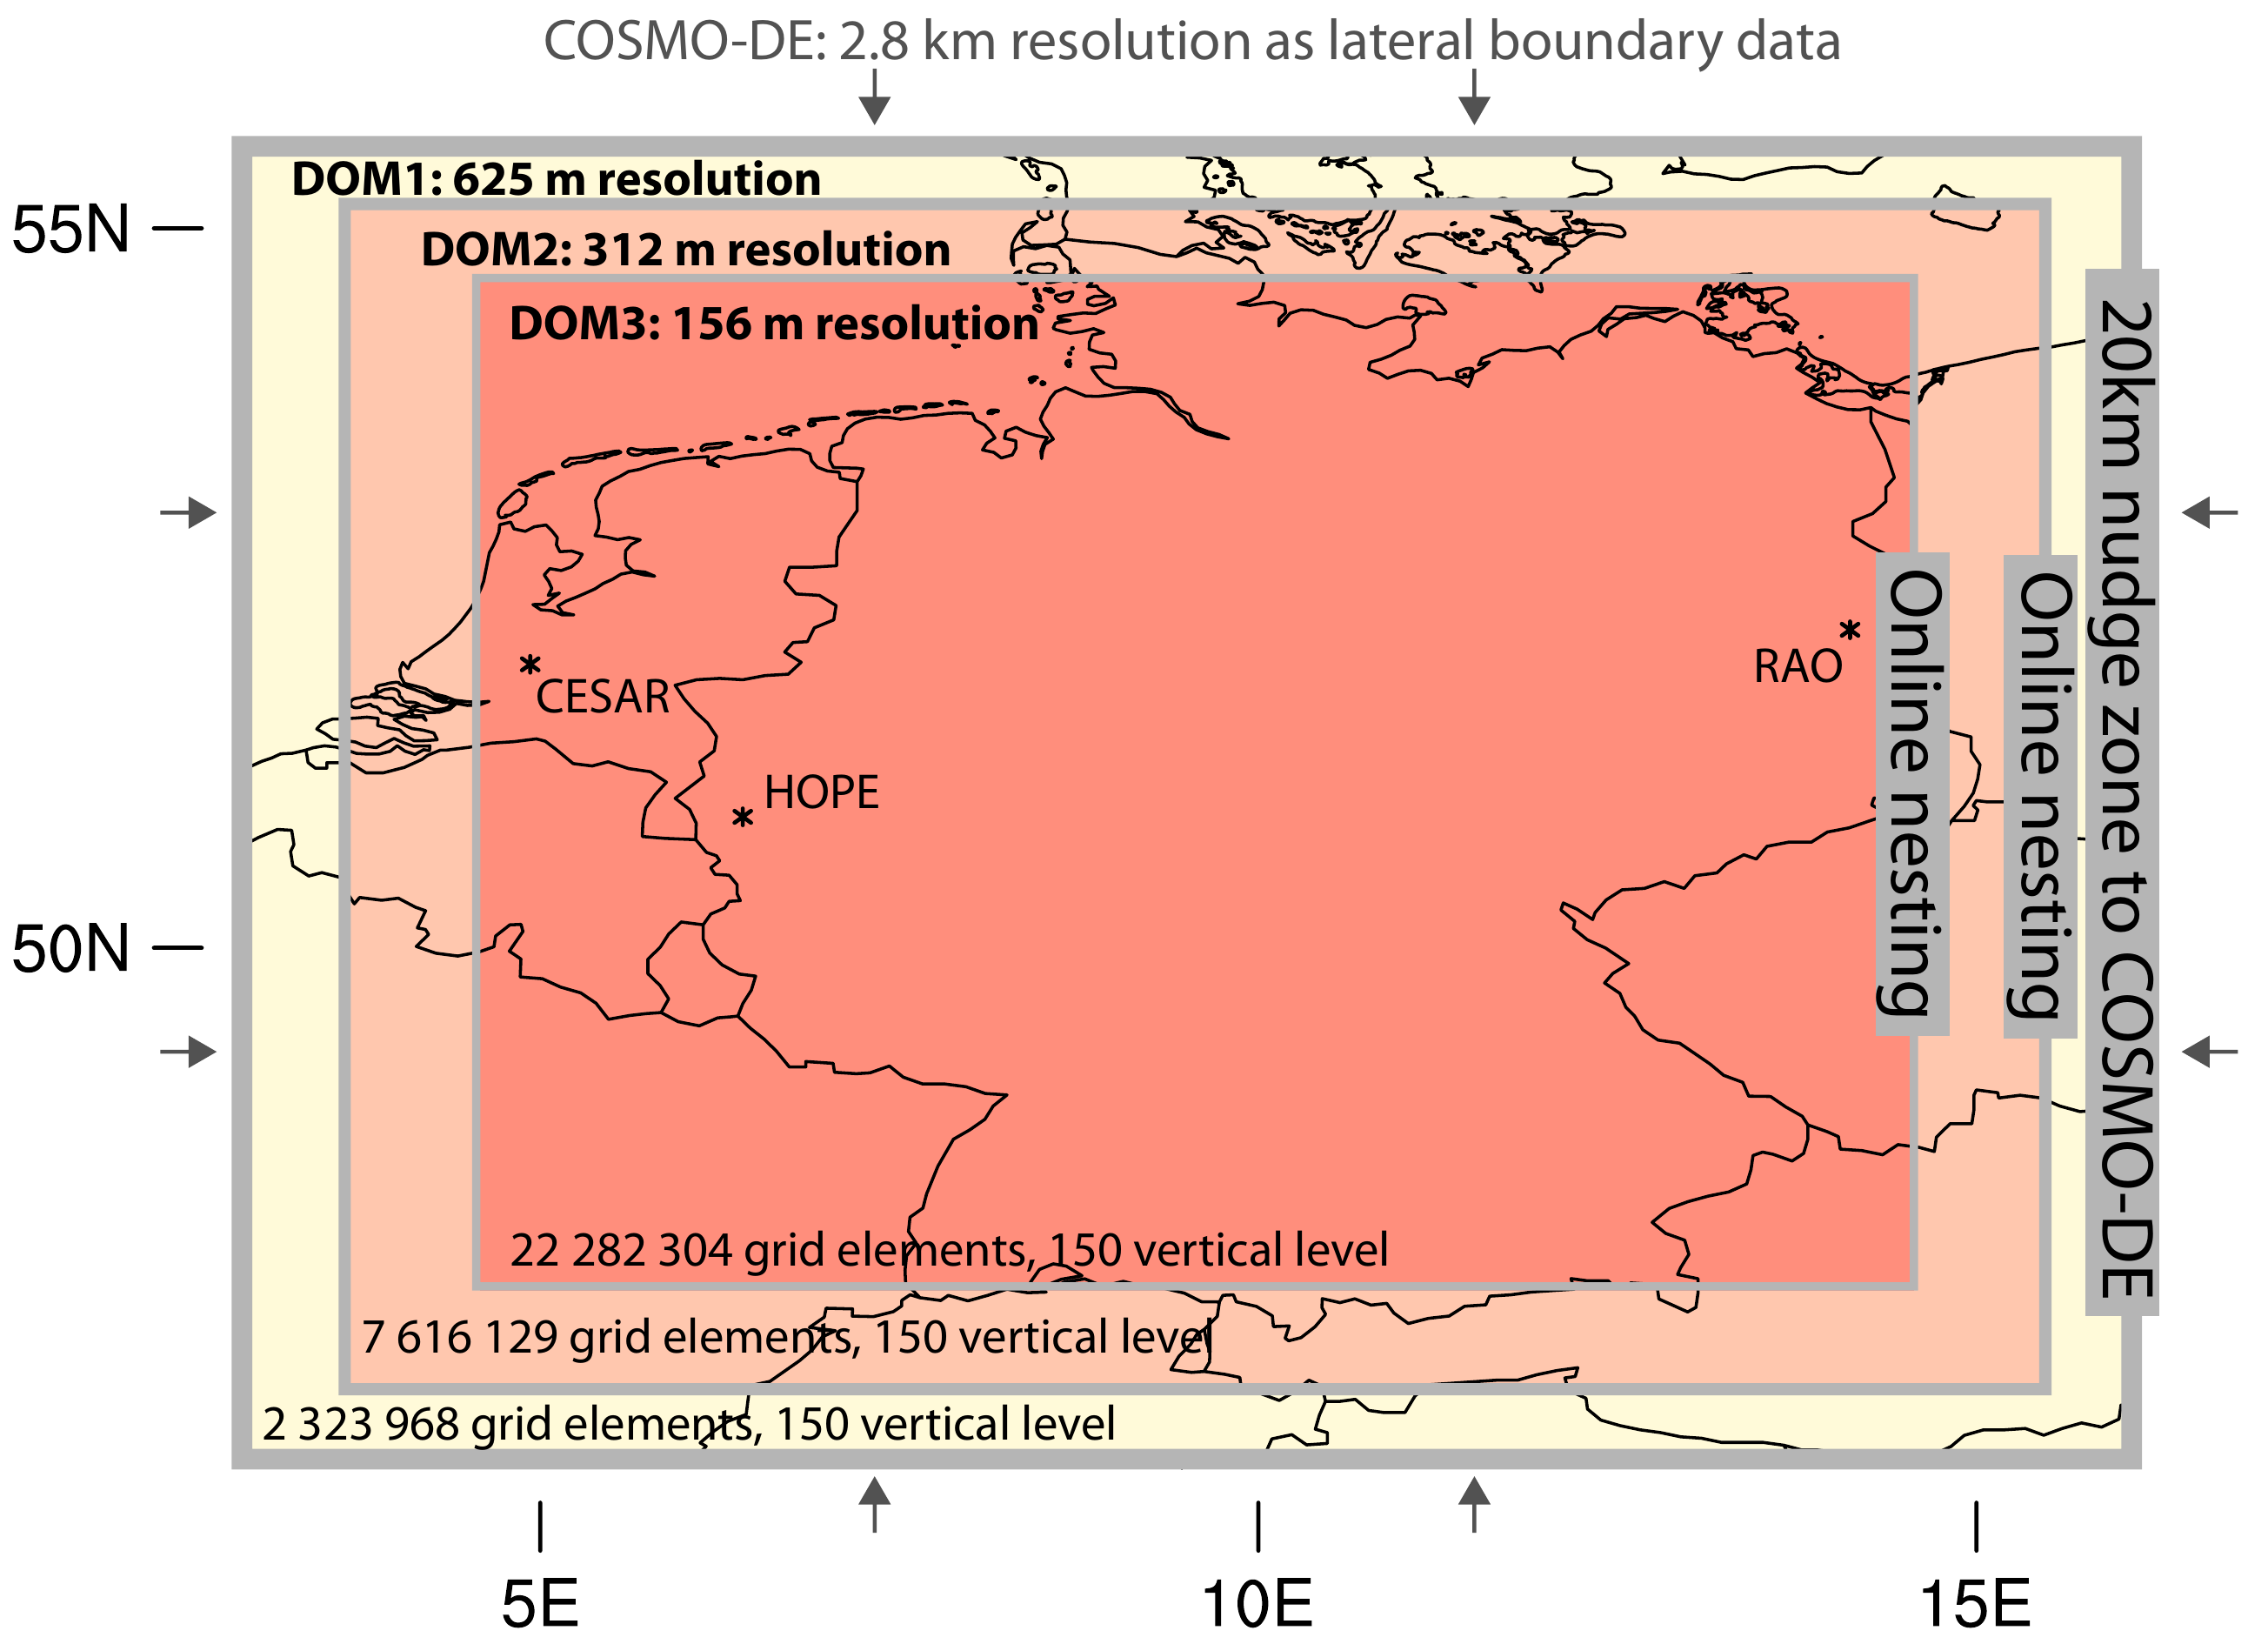
ICON is deployed in a limited-area setup with local two step grid refinement for the area of Germany, as shown in Figure 2. In each refinement step, the resolution is halved from 625m to 312m and 156m in the innermost domain. Here, the term resolution refers to the square root of the mean cell area in the icosahedral grid of ICON, which is equivalent to about 1.5 times the corresponding resolution in a regular grid. 150 vertical levels are used with grid stretching towards the model top at 21km. The minimal layer thickness is 20m near the surface and the lowest 1000m encompass 20 layers. A fast-physics time-step of 3s is used for the coarsest resolution. It is then halved with each refinement step. The slow-physics time-step for calling RRTM radiation is 900s for each domain and is kept constant over the integration time.
Large eddy simulation over such a big domain is as much a computational challenge as a physical one. A total of more than 3.3 billion grid cells have to be advanced in time using a time step of 0.75s in the innermost domain for a total of 4 days. Keeping this in mind, strong effort was put on further optimizing ICON for massive parallelization.

Figure 2. HD(CP)² simulation configuration showing the three domains that are running at different resolutions. The open lateral boundaries are relaxed towards COSMO-DE.
2017 SciVis Contest Data
The HD(CP)² project is proud to be the data sponsor for the 2017 IEEE SciVis Contest. Although the data that is provided for this contest emanates from a virtual computer model, actual weather data through COSMO reanalysis forcing was used to drive the simulation. The data shows the weather development over Germany for April 26, 2013, along with flight trajectories across Europe for this particular day. More information about the variables that are included and how to download the data can be found on the data page.